Observations on Five Institutional Investing Trends
Natixis Investment Managers Solutions portfolio consultants monitor asset classes, investment products and market activity both in real time and from a historical perspective. See which institutional investing trends impacted asset allocation decisions in the second half of 2022.
1. Pension Funded Status Diverges
In a challenging return environment, public funds saw funded status dip from 85.5% at 12/31/2021 to 72.8% at 12/31/2022. Conversely, corporate plans achieved gains, rising from 97.9% to 110.0%, as higher interest rates drove down liability values.
Funded Status by Plan Type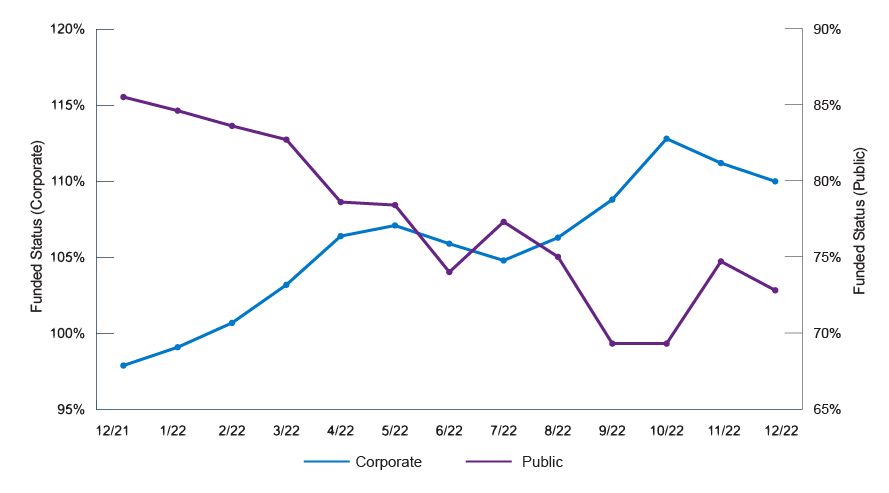 Source: Natixis IM Solutions, Bloomberg
Many components of future return expectations – equity earnings yields, government bond yields, credit spreads – are elevated compared to recent history. But this has not yet led to meaningful increases in investment return assumptions among public funds. Higher assumptions typically lead to higher funded status estimates and lower required contributions. Given significant momentum in recent years toward reducing assumptions, the investment environment could provide plans some breathing room to either keep assumptions flat or move them higher.
Future Returns – Building Blocks, Average ROA of Public Plans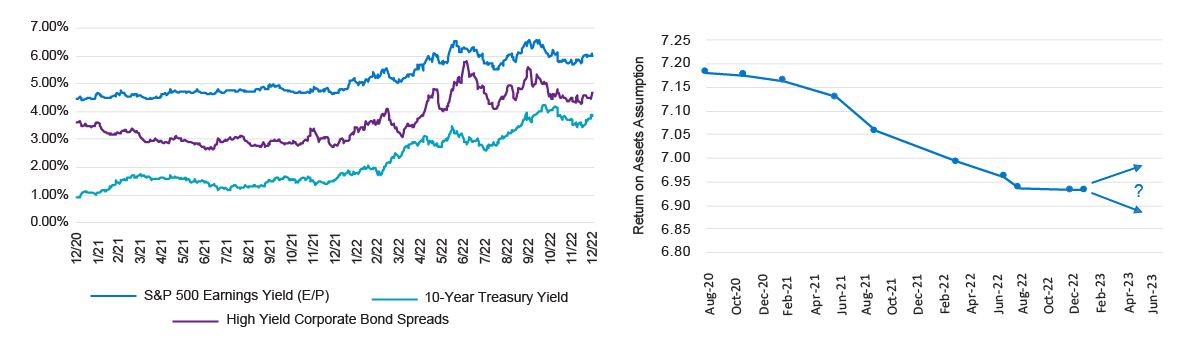
Source: Natixis IM Solutions, FactSet, NASRA
US foundations saw asset levels decline to $1.057 trillion, erasing 3 years of gains. The average foundation lost 15.5% from market returns plus another 3.4% due to the difference in cash flows among grants, expenses, and new contributions.
Foundation Assets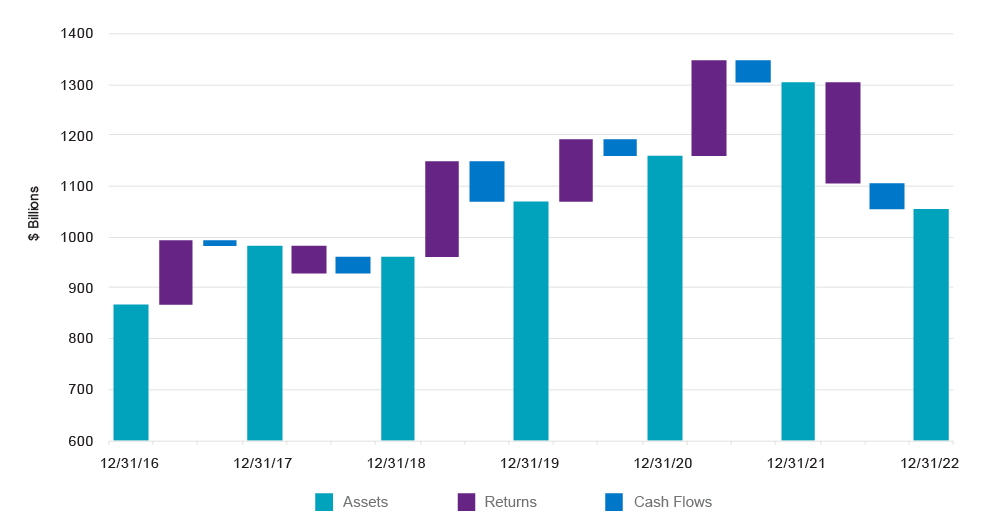
Source: FoundationMark, Natixis IM Solutions
The US Treasury market has seen liquidity erode in recent years, most notably in March 2020, but bid/ask spreads remained somewhat elevated throughout 2022. To help address this, some have called for broader “all-to-all” trading where a larger, more diversified group of potential counterparties including asset managers and institutions could exchange Treasury bonds without settling through a clearinghouse. This could provide greater price transparency and improved liquidity in times of stress.1
Bloomberg U.S. Govt Securities Liquidity Index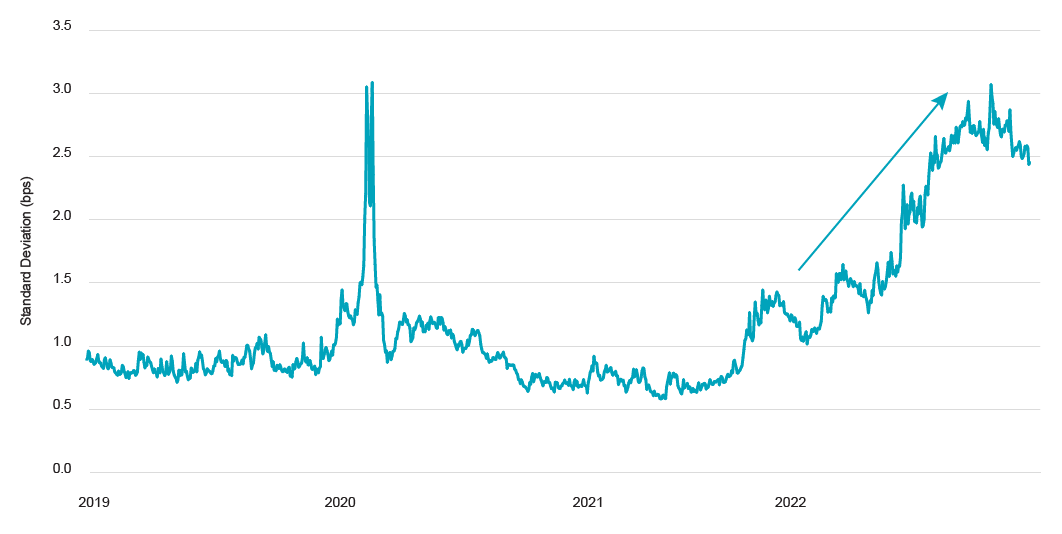
Source: Bloomberg
The first round of multi-employer union pension plans eligible for federal assistance under the March 2021 American Rescue Plan Act began receiving funds in 2022. Per final guidance issued in July, 67% of all relief funds are required to be invested in high quality, investment grade fixed income, with the remaining 33% invested in return-seeking assets. Through 12/30/2022, $45.6 billion had been awarded to 56 plans, covering over 600,000 participants. Many eligible plans will not be able to apply for relief until March 11, 2023. The Pension Benefit Guaranty Corporation (PBGC) estimated the final cost of the program to be $94 billion, covering over 200 plans.2
Institutional Investing Trends
This summary discusses foundations and public pensions losing ground, calls for all-to-all trading potentially bringing improved transparency and liquidity, and indicators suggesting elevated return potential.
Download PDF
Learn More
Interested to see how institutions’ funded status and asset levels will respond to 2023 market conditions?
Contact Us
2 Source: Pensions & Investments, PBGC
S&P 500® Index is a widely recognized measure of US stock market performance. It is an unmanaged index of 500 common stocks chosen for market size, liquidity, and industry group representation, among other factors. It also measures the performance of the large-cap segment of the US equities market.
This content is provided for informational purposes only and should not be construed as investment advice. Any opinions or forecasts contained herein reflect the subjective judgments and assumptions of the author only and do not necessarily reflect the views of Natixis Investment Managers, or any of its affiliates. There can be no assurance that developments will transpire as forecasted and actual results will be different. Data and analysis does not represent the actual or expected future performance of any investment product. We believe the information, including that obtained from outside resources, to be correct, but we cannot guarantee its accuracy. The information is subject to change at any time without notice.
The data contained herein is the result of analysis conducted by the Natixis Investment Managers Solutions consulting team on model portfolios submitted by Investment Professionals. The Moderate Peer Group consists of model portfolios that have been analyzed by the consulting team and have been designated as moderate by Investment Professionals.
Natixis Investment Managers Solutions collects portfolio data and aggregates that data in accordance with the peer group portfolio category that is assigned to an individual portfolio by the Investment Professionals. At such time that a Professional requests a report, the Professional will categorize the portfolios as a portfolio belonging to one of the following categories: Aggressive, Moderately Aggressive, Moderate, Moderately Conservative, or Conservative. The categorization of individual portfolios is not determined by Natixis Investment Managers Solutions as its role is solely as an aggregator of the pre-categorized portfolios. Please note that risk attributes of the Moderate Peer Group will change over time due to movements in the capital markets. Portfolio allocations provided to Natixis Investment Managers Solutions are static in nature and subsequent changes in a Professional’s portfolio allocations may not be reflected in the current Moderate Peer Group data.
Investing involves risk, including the risk of loss. Investment risk exists with equity, fixed income, international and emerging markets. Additionally, alternative investments, including managed futures, can involve a higher degree of risk and may not be suitable for all investors. There is no assurance that any investment will meet its performance objectives or that losses will be avoided.
This document may contain references to copyrights, indexes and trademarks that may not be registered in all jurisdictions. Third-party registrations are the property of their respective owners and are not affiliated with Natixis Investment Managers or any of its related or affiliated companies (collectively “Natixis”). Such third-party owners do not sponsor, endorse or participate in the provision of any Natixis services, funds or other financial products.
Index information contained herein is derived from third parties and is provided on an “as is” basis. The user of this information assumes the entire risk of use of this information. Each of the third-party entities involved in compiling, computing or creating index information disclaims all warranties (including, without limitation, any warranties of originality, accuracy, completeness, timeliness, non-infringement, merchantability and fitness for a particular purpose) with respect to such information.
CFA® and Chartered Financial Analyst® are registered trademarks owned by the CFA Institute.
5440825.2.1