Institutional Investing Trends Observed at Midyear 2022
The Natixis Investment Managers Solutions team monitors asset classes, investment products and market action, both in real time and from a historical perspective. At midyear 2022, see which institutional investing trends impacted asset allocation decisions.
1. (Almost) No Place to Hide
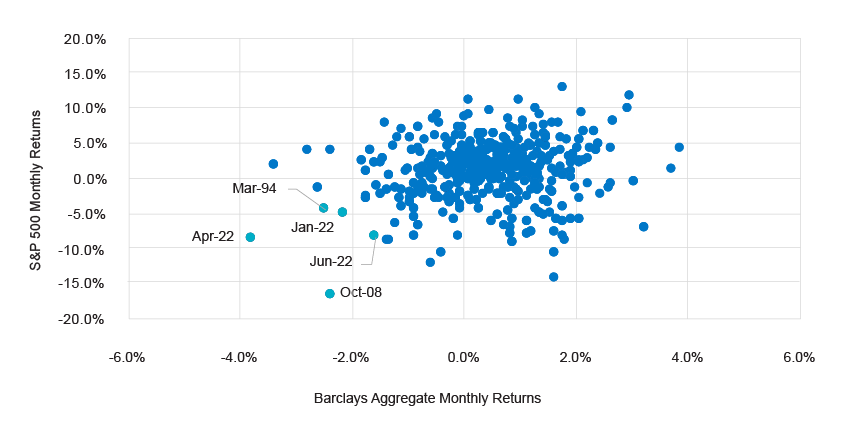
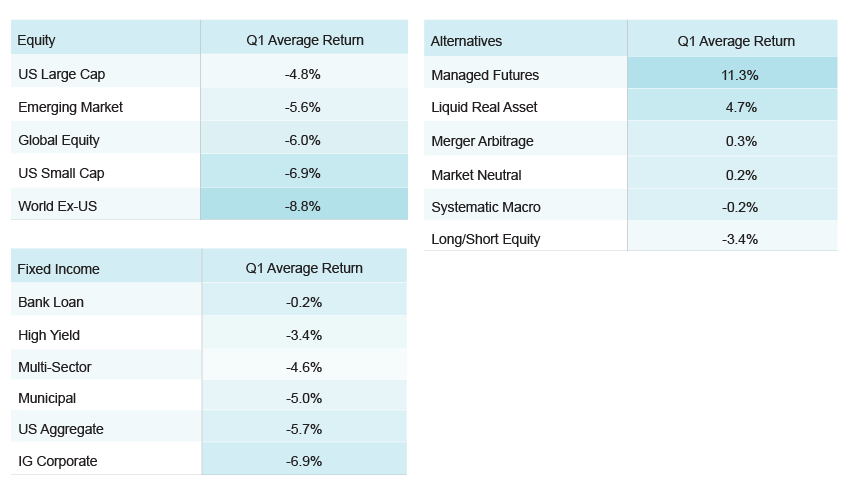
Stock/bond correlations spiked in 1H 2022. Three out of the first six months of the year constituted a “diversification failure,” which we define as an S&P 500 return of less than -4%, and a Bloomberg Aggregate return of less than -1.5%, a combination that has occurred in only two other months since 1988. With equity and fixed income both down, alternatives categories were top performers.
S&P vs. Barclays Agg (1988-2022)
(Almost) No Place to Hide, Continued...
 Source: Natixis Investment Managers Solutions, FactSet, eVestment
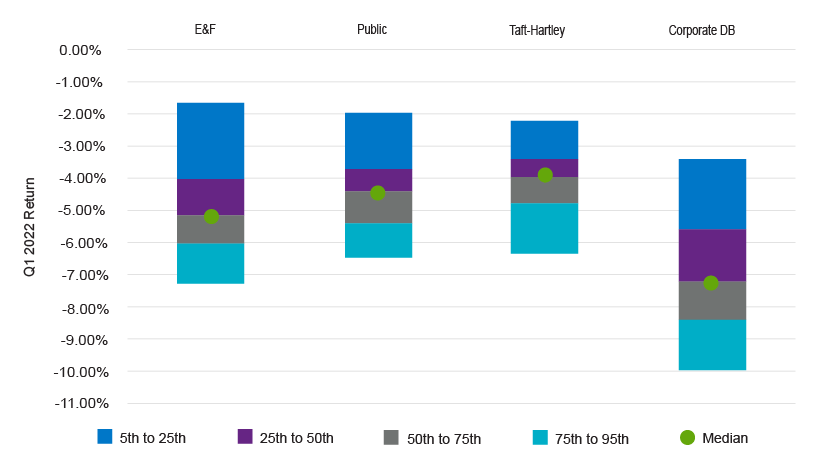
By plan type, Taft-Hartley portfolios had the highest median return for Q1 2022 at -4%, while the lowest returning cohort was corporate defined benefit plans at -7.3%. With equity and fixed income returns down similarly in magnitude, portfolios with higher allocations to alternatives enjoyed relative outperformance.
Q1 2022 Performance by Percentile
 Source: InvMetrics
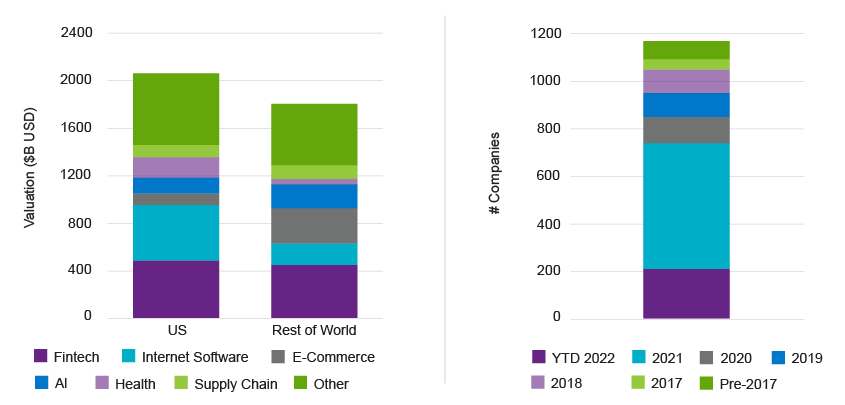
There are now over 1,100 global privately held startup companies valued at $1 billion or higher, commonly (and now somewhat ironically) referred to as “unicorns.” The total cohort, represented by industries like fintech, internet software, e-commerce, and artificial intelligence, comprises $3.9 trillion in aggregate valuation. In stark contrast to the recent environment for public equity valuations, more than 200 of these companies achieved unicorn status over the past six months.
Unicorns $ by Industry | Unicorn Status by Year
 Sources: Natixis Investment Managers Solutions, CB Insights; https://www.cbinsights.com/research-unicorn-companies
The spike in corporate bond yields saw discount rates for corporate pension clients increase from 2.96% (at 12/31/21) to 4.67% (at 6/30/22), a 26.5% decrease in liability values. The funded status of the 100 largest US corporate defined benefit plans rose to 107.0%, the highest level since October 2007. US corporations took advantage of the environment, with $5.4 billion in Q1 2022 pension risk transfer sales representing the highest first quarter ever recorded.1
Citigroup Above Median Yield Curve
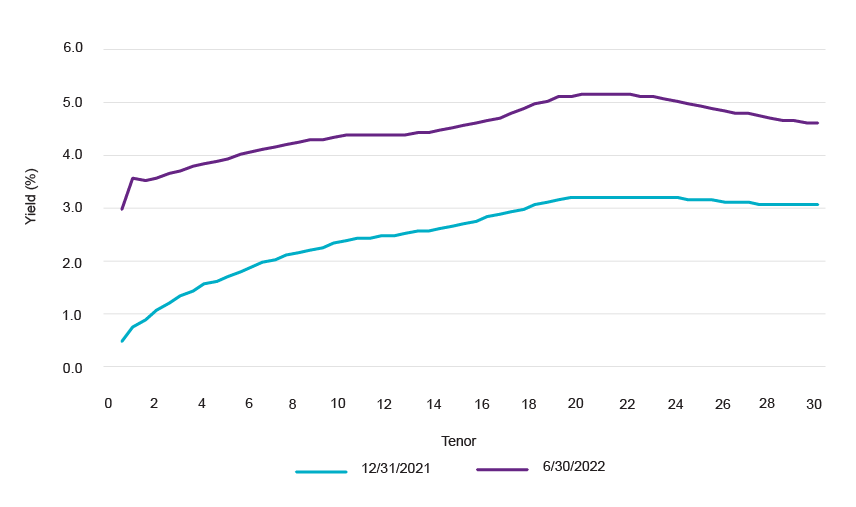 Source: FTSE
Milliman 100 Pension Funding Index (12/31/99-6/30/22)
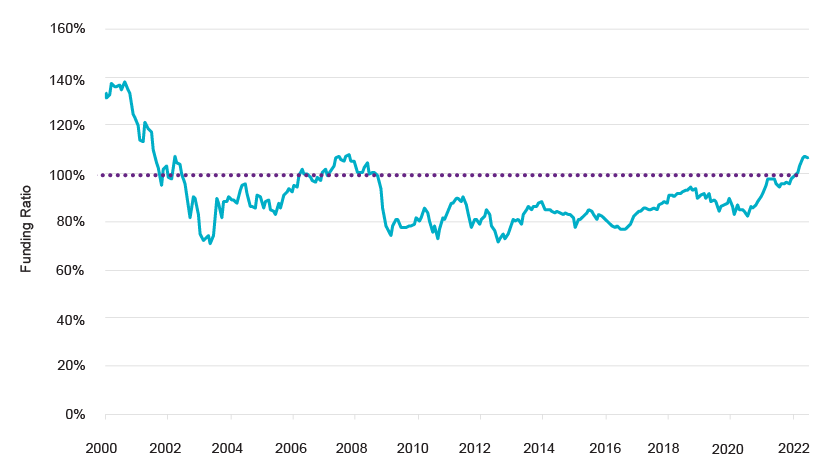 Source: Bloomberg
Institutional investors continue to see slight fee reductions across active US and non-US large-cap categories, while small-cap and fixed income results are more mixed.
Average Stated Fee (First Dollar)
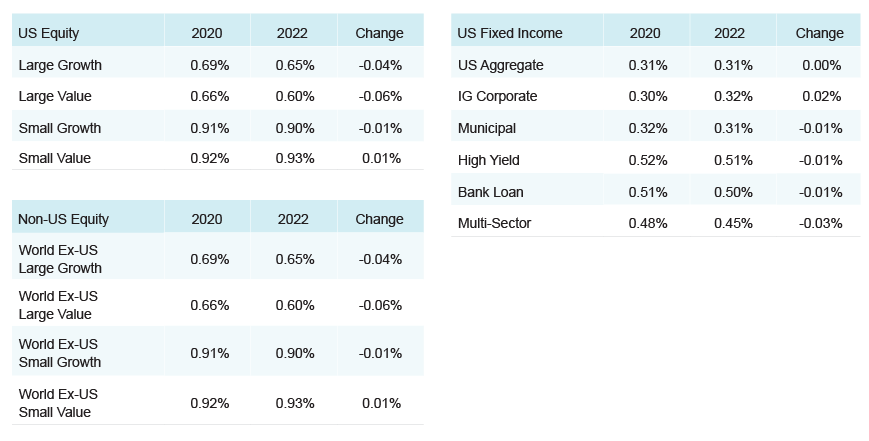 Source: eVestment
Resource
Institutional Investing Trends at Midyear 2022
This midyear summary covers alternatives outshining disappointing equity and fixed income returns, increasing numbers of privately held startups, spiking corporate bond yields, and some modest fee reductions for institutional investors.
Download PDF
Learn More
Curious about how stock and bond correlations will fare through the rest of 2022?
Contact Us
S&P 500® Index is a widely recognized measure of US stock market performance. It is an unmanaged index of 500 common stocks chosen for market size, liquidity, and industry group representation, among other factors. It also measures the performance of the large-cap segment of the US equities market.
This content is provided for informational purposes only and should not be construed as investment advice. Any opinions or forecasts contained herein reflect the subjective judgments and assumptions of the author only and do not necessarily reflect the views of Natixis Investment Managers, or any of its affiliates. There can be no assurance that developments will transpire as forecasted and actual results will be different. Data and analysis does not represent the actual or expected future performance of any investment product. We believe the information, including that obtained from outside resources, to be correct, but we cannot guarantee its accuracy. The information is subject to change at any time without notice.
The data contained herein is the result of analysis conducted by the Natixis Investment Managers Solutions consulting team on model portfolios submitted by Investment Professionals. The Moderate Peer Group consists of model portfolios that have been analyzed by the consulting team and have been designated as moderate by Investment Professionals.
Natixis Investment Managers Solutions collects portfolio data and aggregates that data in accordance with the peer group portfolio category that is assigned to an individual portfolio by the Investment Professionals. At such time that a Professional requests a report, the Professional will categorize the portfolios as a portfolio belonging to one of the following categories: Aggressive, Moderately Aggressive, Moderate, Moderately Conservative, or Conservative. The categorization of individual portfolios is not determined by Natixis Investment Managers Solutions as its role is solely as an aggregator of the pre-categorized portfolios. Please note that risk attributes of the Moderate Peer Group will change over time due to movements in the capital markets. Portfolio allocations provided to Natixis Investment Managers Solutions are static in nature and subsequent changes in a Professional’s portfolio allocations may not be reflected in the current Moderate Peer Group data.
Investing involves risk, including the risk of loss. Investment risk exists with equity, fixed income, international and emerging markets. Additionally, alternative investments, including managed futures, can involve a higher degree of risk and may not be suitable for all investors. There is no assurance that any investment will meet its performance objectives or that losses will be avoided.
This document may contain references to copyrights, indexes and trademarks that may not be registered in all jurisdictions. Third-party registrations are the property of their respective owners and are not affiliated with Natixis Investment Managers or any of its related or affiliated companies (collectively “Natixis”). Such third-party owners do not sponsor, endorse or participate in the provision of any Natixis services, funds or other financial products.
Index information contained herein is derived from third parties and is provided on an “as is” basis. The user of this information assumes the entire risk of use of this information. Each of the third-party entities involved in compiling, computing or creating index information disclaims all warranties (including, without limitation, any warranties of originality, accuracy, completeness, timeliness, non-infringement, merchantability and fitness for a particular purpose) with respect to such information.
CFA® and Chartered Financial Analyst® are registered trademarks owned by the CFA Institute.
4824127.2.2